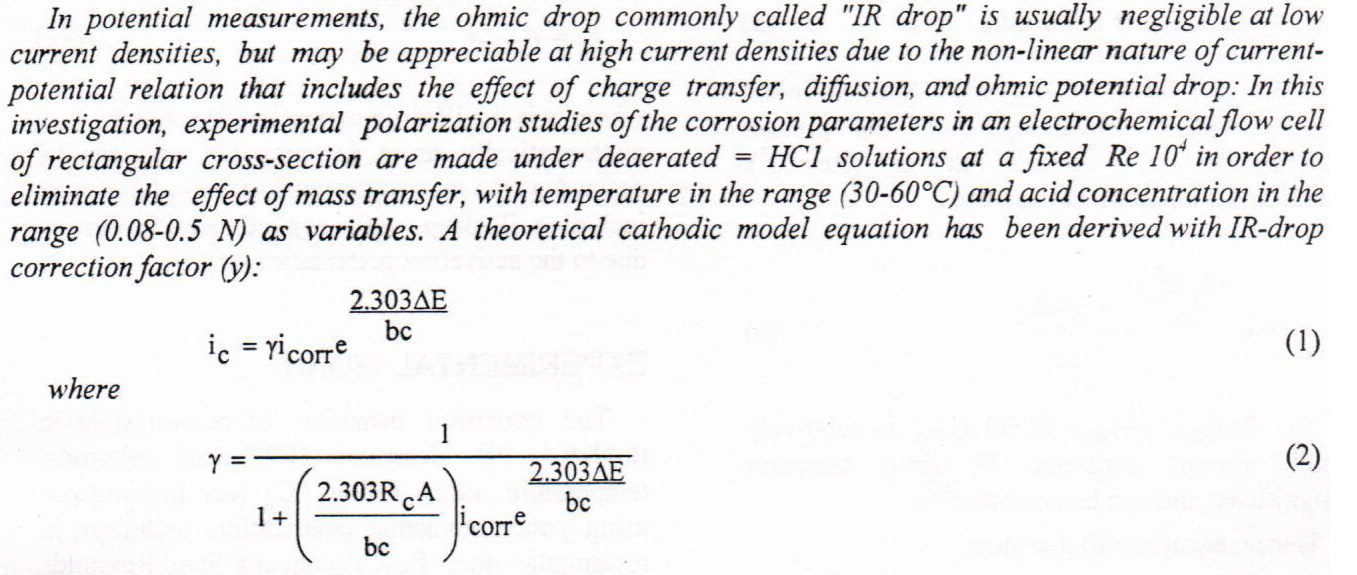
Determination of Corrosion Parameters for a Cathodic Reaction Complicated by IR Drop Effect in a Flow System
This paper proposes a self organizing fuzzy controller as an enhancement level of the fuzzy controller. The adjustment mechanism provides explicit adaptation to tune and update the position of the output membership functions of the fuzzy controller. Simulation results show that this controller is capable of controlling a non-linear time varying system so that the performance of the system improves so as to reach the desired state in a less number of samples.
Tested effective Alttafaria some materials used for different purposes, system a bacterial mutagenesis component of three bacterial isolates belonging to different races and materials tested included drug Briaktin
With time progress importance of hiding information become more and more and all steganography applications is like computer games between hiding and extracting data, or like thieves and police men always thieve hides from police men in different ways to keep him out of prison. The sender always hides information in new way in order not to be understood by the attackers and only the authorized receiver can open the hiding message. This paper explores our proposed random method in detail, how chooses locations of pixel in randomly , how to choose a random bit to hide information in the chosen pixel, how it different from other approaches, how applying information hiding criteria on the proposed project, and attempts to test out in code, and
... Show MoreBackground: Despite the fact that asthma is a long-term disease that may be treated, many people are unable to control their symptoms due to a lack of knowledge about their condition. The study's purpose was to find out if a pharmacist intervention improved asthma management because of this.
Objective: this study designed to assess the effect of pharmaceutical care on pulmonary functions test.
Method: The study was completed in three months. The patients who were enrolled were divided into two groups: Group 1 consists of 23 asthma patients who were randomly assigned to receive conventional therapy for chronic bronchial asthma based on disease stage and se
... Show MoreThis work presents a completely new develop an analyzer, named NAG-5SX1-1D-SSP, that is simple, accurate, reproducible, and affordable for the determination of cefotaxime sodium (CFS) in both pure and pharmaceutical drugs. The analyzer was designed according to flow injection analysis, and conducted to turbidimetric measurements. Ammonium cerium nitrate was utilized as a precipitating agent. After optimizing the conditions, the analysis system exhibited a linear range of 0.008-27 mmol. L-1 (n=29), with a limit of detection of 439.3 ng/sample, a limit of quantification of 0.4805 mg/sample, and a correlation coefficient of 0.9988. The repeatability of the responses was assessed by performing six successive injections of CFS at concentra
... Show Morea porentioncsisteve has been carried out of the corrosion behavior of inconel(600) in chloride ions (Cl) over the tempreatures 293 over the temperatures 308K in both the dcacrated and the alloy
The inhibitor property of curcuma longa L. extract in different concentrations of simulated refinery wastewater (0.05% - 2% wt) and at various temperatures (30, 35 and 40 ˚C) was investigated using weight loss method. The results showed that the presence of about 1.2 % (v/v) of curcuma extract gave about 84% inhibition indicating its effectiveness on mild steel corrosion in simulated refinery wastewater, besides the adsorption process on the mild steal surface obeyed the Langmuir adsorption isotherm.
Phenylthiourea (PHTU),was tested as inhibitor for the corrosion of low carbon steel in different HCI acid concentration by mass loss ,and polarization measurements .it was found that (PHTU) is a good inhibitor for the corrosion of low carbon steel in 1,3,and 5N HCI solution ,and its inhibition efficiency (0) increases with its concentration and attains approximately 97% at l g/I .polarization curves indicate that (PHTU) acts as an anodic type inhibitor .the inhibitor was adsorbed on the low carbon steel surface according to the Langmuir adsorption isotherm model. Results show that the rate of corrosion of low carbon steel increased with increasing temperature o
... Show More