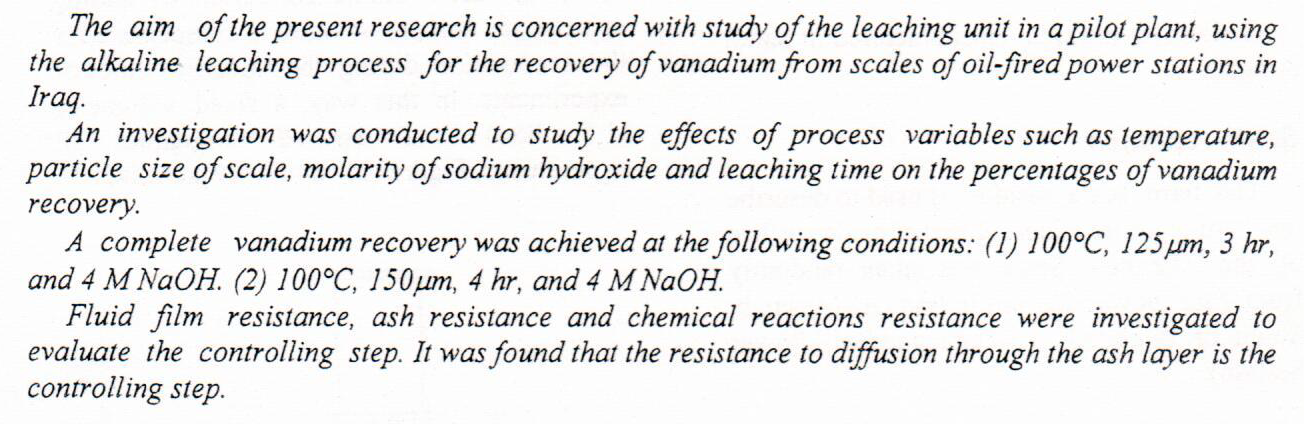
Recovery of Vanadium from Scale Residues of Oil-Fired Power Stations

Increasing hydrocarbon recovery from tight reservoirs is an essential goal of oil industry in the recent years. Building real dynamic simulation models and selecting and designing suitable development strategies for such reservoirs need basically to construct accurate structural static model construction. The uncertainties in building 3-D reservoir models are a real challenge for such micro to nano pore scale structure. Based on data from 24 wells distributed throughout the Sadi tight formation. An application of building a 3-D static model for a tight limestone oil reservoir in Iraq is presented in this study. The most common uncertainties confronted while building the model were illustrated. Such as accurate estimations of cut-off
... Show More (2)
(2)

In this work, fluid catalytic cracking of vacuum gas oil to produce gasoline over prepared faujasite type Y zeolite was investigated using experimental laboratory plant scale of fluidized bed reactor.
The catalytic activity of prepared faujasite type NaY, NaNH4Y and NaHY zeolites was investigated. The cracking process was carried out in the temperature range 440 to 500 oC, weight hourly space velocity (WHSV) range 10 to 25 h-1 ,and atmospheric pressure . The catalytic activities of the prepared faujasite type NaY , NaNH4Y and NaHY zeolites were determined in terms of vacuum gas oil (VGO) conversion, and gasoline yield . The conversion at 500oC and WHSV10 hr-1 by using faujasite type NaY, NaNH4Y and NaHY zeolite were 50.2%, 64.1% and 6
The purpose of this study is to measure the levels of quality control for some crude oil products in Iraqi refineries, and how they are close to the international standards, through the application of statistical methods in quality control of oil products in Iraqi refineries. Where the answers of the study sample were applied to a group of Iraqi refinery employees (Al-Dora refinery, Al-Nasiriyah refinery, and Al-Basra refinery) on the principles of quality management control, and according to the different personal characteristics (gender, age, academic qualification, number of years of experience, job level). In order to achieve the objectives of the study, a questionnaire that included (12) items, in order to collect preliminary inform
... Show More
Mishrif Formation is the main reservoir in Amara Oil Field. It is divided into three units (MA, TZ1, and MB12). Geological model is important to build reservoir model that was built by Petrel -2009. FZI method was used to determine relationship between porosity and permeability for core data and permeability values for the uncored interval for Mishrif formation. A reservoir simulation model was adopted in this study using Eclipse 100. In this model, production history matching executed by production data for (AM1, AM4) wells since 2001 to 2015. Four different prediction cases have been suggested in the future performance of Mishrif reservoir for ten years extending from June 2015 to June 2025. The comparison has been mad
... Show MoreIn this study, the upgrading of Iraqi heavy crude oil was achieved utilizing the solvent deasphalting approach (SDA) and enhanced solvent deasphalting (e-SDA) by adding Nanosilica (NS). The NS was synthesized from local sand. The XRD result, referred to as the amorphous phase, has a wide peak at 2Θ= (22 - 23º) The inclusion of hydrogen-bonded silanol groups (Si–O–H) and siloxane groups (Si–O–Si) in the FTIR spectra. The SDA process was handled using n-pentane solvent at various solvent to oil ratios (SOR) (4-16/1ml/g), room and reflux temperature, and 0.5 h mixing time. In the e-SDA process, various fractions of the NS (1–7 wt.%) have been utilized with 61 nm particle size and 560.86 m²/g surface area in the presence of 12 m
... Show More (13)
(8)
(13)
(8)


There is a growing interest in studying the effects of arthritis on a person's work productivity using a growing variety of outcome indicators.
To develop a valid and reliable shortened version of the Workplace Activity Limitation Scale 12 (WALS‐12) for assessing work productivity limitations in rheumatoid arthritis (RA) patients.
A cross‐sectional study involving 277 RA patients was conducted. An exploratory factor analysis on WALS‐12 was used for item reduction on the first sample. Then confirmatory factor ana
(1)
(1)
Today the NOMA has exponential growth in the use of Optical Visible Light Communication (OVLC) due to good features such as high spectral efficiency, low BER, and flexibility. Moreover, it creates a huge demand for electronic devices with high-speed processing and data rates, which leads to more FPGA power consumption. Therefore; it is a big challenge for scientists and researchers today to recover this problem by reducing the FPGA power and size of the devices. The subject matter of this article is producing an algorithm model to reduce the power consumption of (Field Programmable Gate Array) FPGA used in the design of the Non-Orthogonal Multiple Access (NOMA) techniques applied in (OVLC) systems combined with a blue laser. However, The po
... Show MoreThis paper experimentally investigates the heating process of a hot water supply using a neural network implementation of a self-tuning PID controller on a microcontroller system. The Particle Swarm Optimization (PSO) algorithm employed in system tuning proved very effective, as it is simple and fast optimization algorithm. The PSO method for the PID parameters is executed on the Matlab platform in order to put these parameters in the real-time digital PID controller, which was experimented with in a pilot study on a microcontroller platform. Instead of the traditional phase angle power control (PAPC) method, the Cycle by Cycle Power Control (CBCPC) method is implemented because it yields better power factor and eliminates harmonics
... Show More
(1)
The influence of 5-10 kHz audio frequency on the power dissipation in ac discharge of argon gas was studied experimentally, at pressures 50-80 mTorr and electrodes separation 10 cm (pd range 0.5-0.8 Torr.
cm). The measurements have shown that the discharge behavior in the ac circuit is equivalent to a series RC circuit. It is observed that the variation curve of discharge power P with the frequency f is approximately has a Gaussian shape. It is also observed that the curve of Pm- pd is the inverse of Paschen curve, where Pm is the maximum power in the frequency range. The time of breakdown is estimated from the curve of P- f.